Using the Newforma Konekt Power BI Dashboard Template
Our data analytics solution is only available as part of the Newforma Konekt Enterprise subscription package (see Newforma Konekt Packages).
Newforma Konekt’s Power BI dashboard template allows project managers to monitor the health of multiple projects simultaneously, and define custom KPIs to compare and benchmark cross-project performance.
Once configured, the template can be opened and explored in Power BI Desktop, or uploaded to the Power BI service, making the data accessible for consumption by all stakeholders (see Configuring the Newforma Konekt Power BI Dashboard).
Things to know
- A dashboard template can be connected to one hub hosted in the region of your choice (Canada, United States, Europe).
- It is also important to note that once the template is in your possession, it belongs to you and can be customized to your needs. If this is the case, you must maintain the original copy of the template when breaking changes are made, or ask our team to do it for you (additional services).
- The template can be opened and explored in Power BI Desktop, or uploaded to the Power BI service to be shared via link. If you have sensitive information that you wish to protect, you must use a Power BI Pro license, which is included in Microsoft 365 E5.
Dashboard template overview
Our Power BI dashboard template allows your team to see, in one glance, all the project coordination metrics that matter, and can be used to analyze how to take action. It has four pages of visuals you can explore and interact with to discover insights from your data.
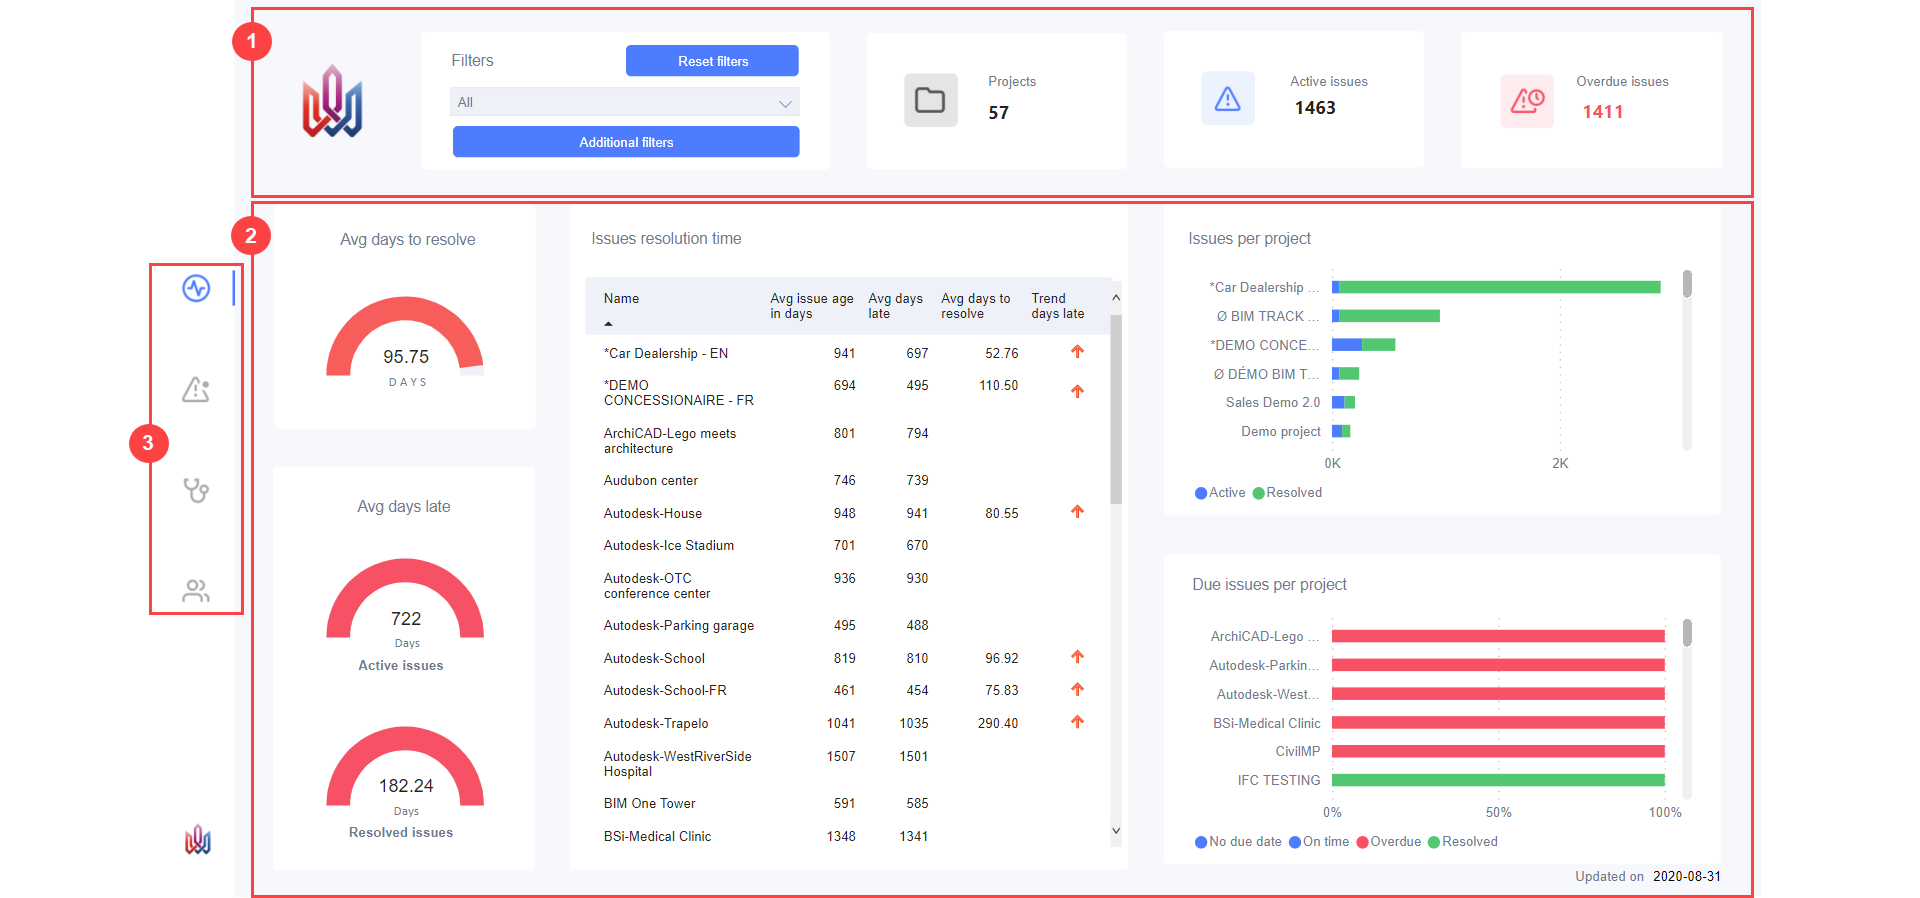
On each page, at the top (1), you can use the filters to select one or multiple projects within your hub and view generic visuals about their issues. The other visuals represent different insights that have been discovered in your project data (2). To navigate between the different pages of the template, simply click the navigation tabs (3). The following sections describe the content of each page.
1. Multi project monitoring
The Multi project monitoring page is the first page of the template. It gives project managers the state of the project(s) selected. The two visuals on the left show important KPIs: Average days to resolve and Average days late. On the right of the KPIs, are three visuals: Issues resolution time, Issues per project, and Due issues per project.
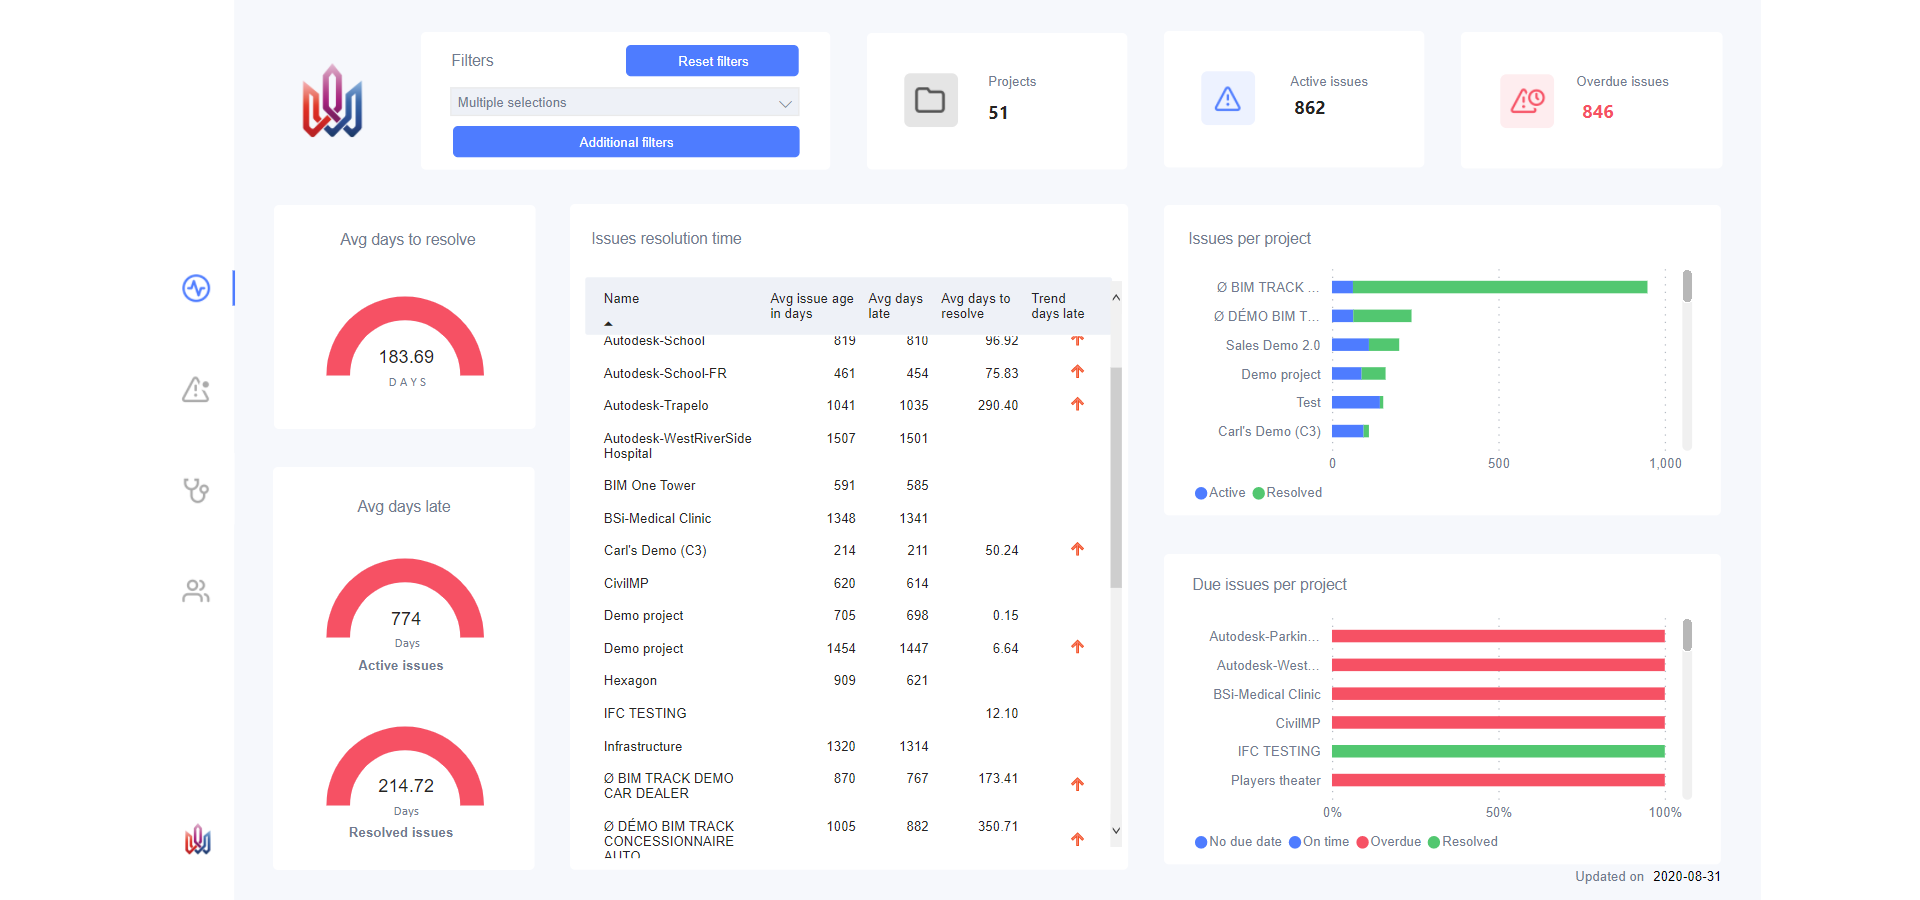
Issue resolution time shows how on track you are with your issues in terms of resolution. Issues per project shows how many issues are active and how many are resolved on the entire project and can be used as a coordination activity indicator, and Due issues per project indicates which of your issues are overdue and which are on time and can be used as an indicator of at risk projects. When you hover over a data bar in those, a tooltip will show up and provide the count of issues. You can also right-click on a data bar to find different insights.
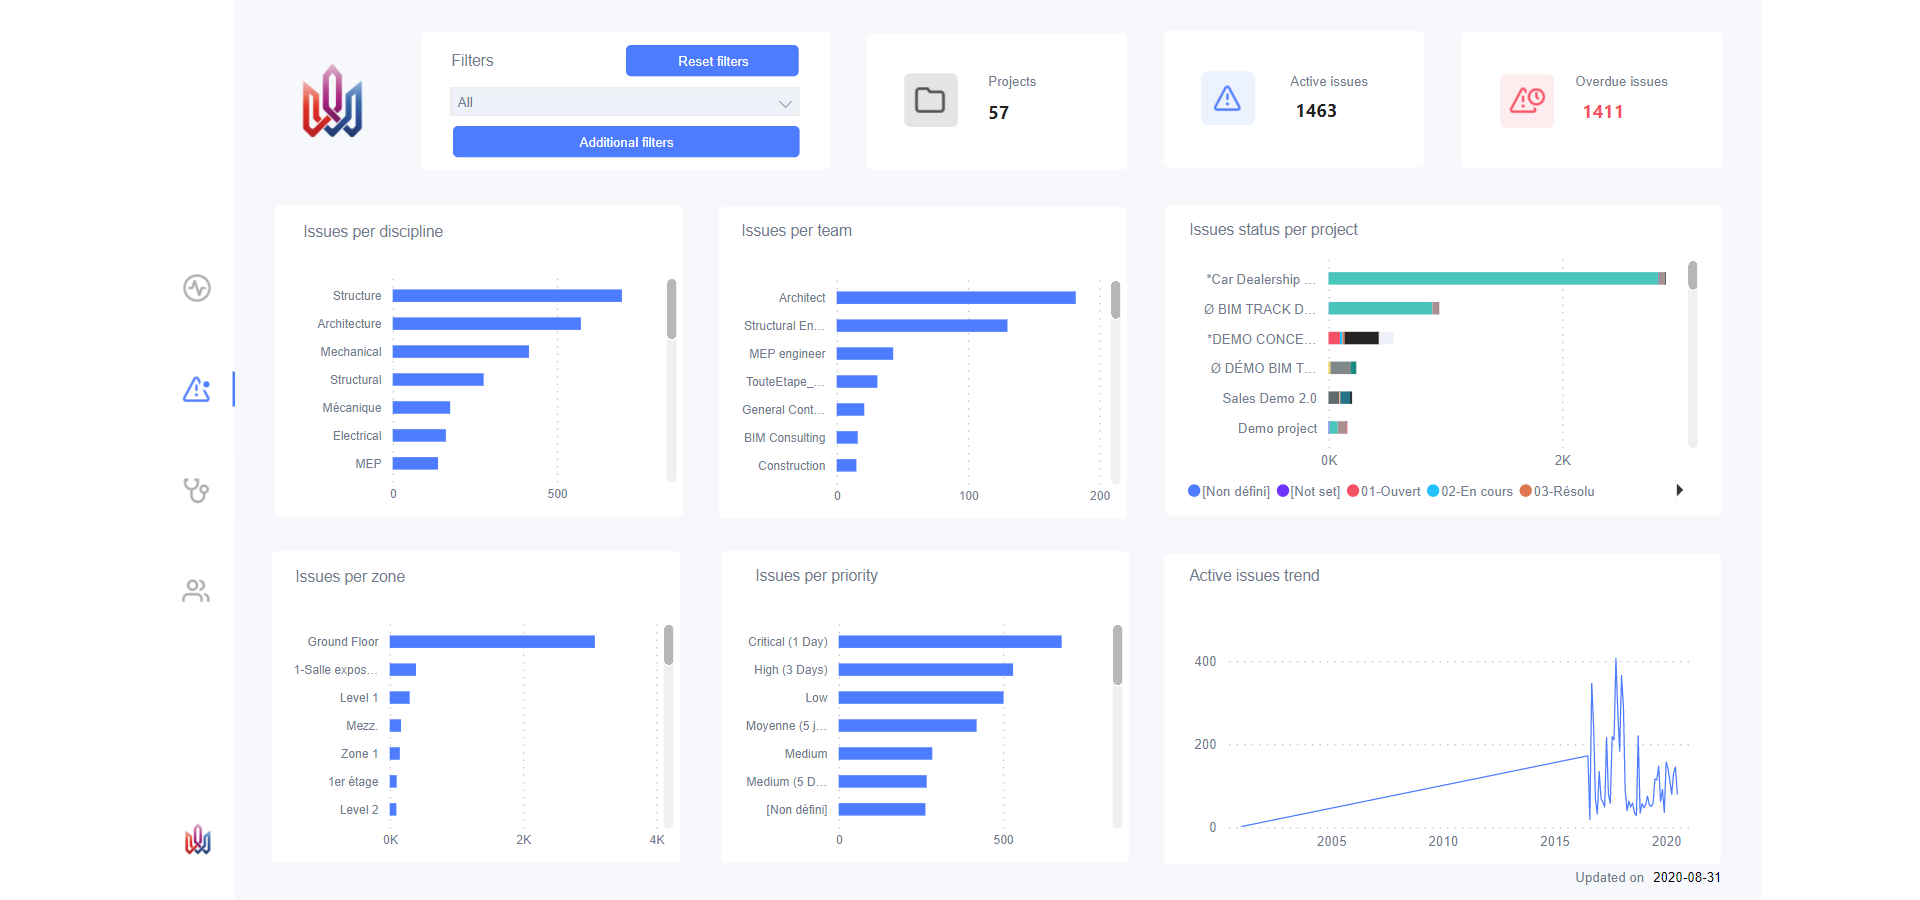
2. Issues segmentation
On the Issues segmentation page, issues are organized by discipline, zone, team, priority and status per project. It is important to note that issues with two disciplines are counted twice. The page also displays the Active issue trend which represents the coordination activity period. This page can be useful for BIM/VDC managers to get an overview of active issues.
3. Project health
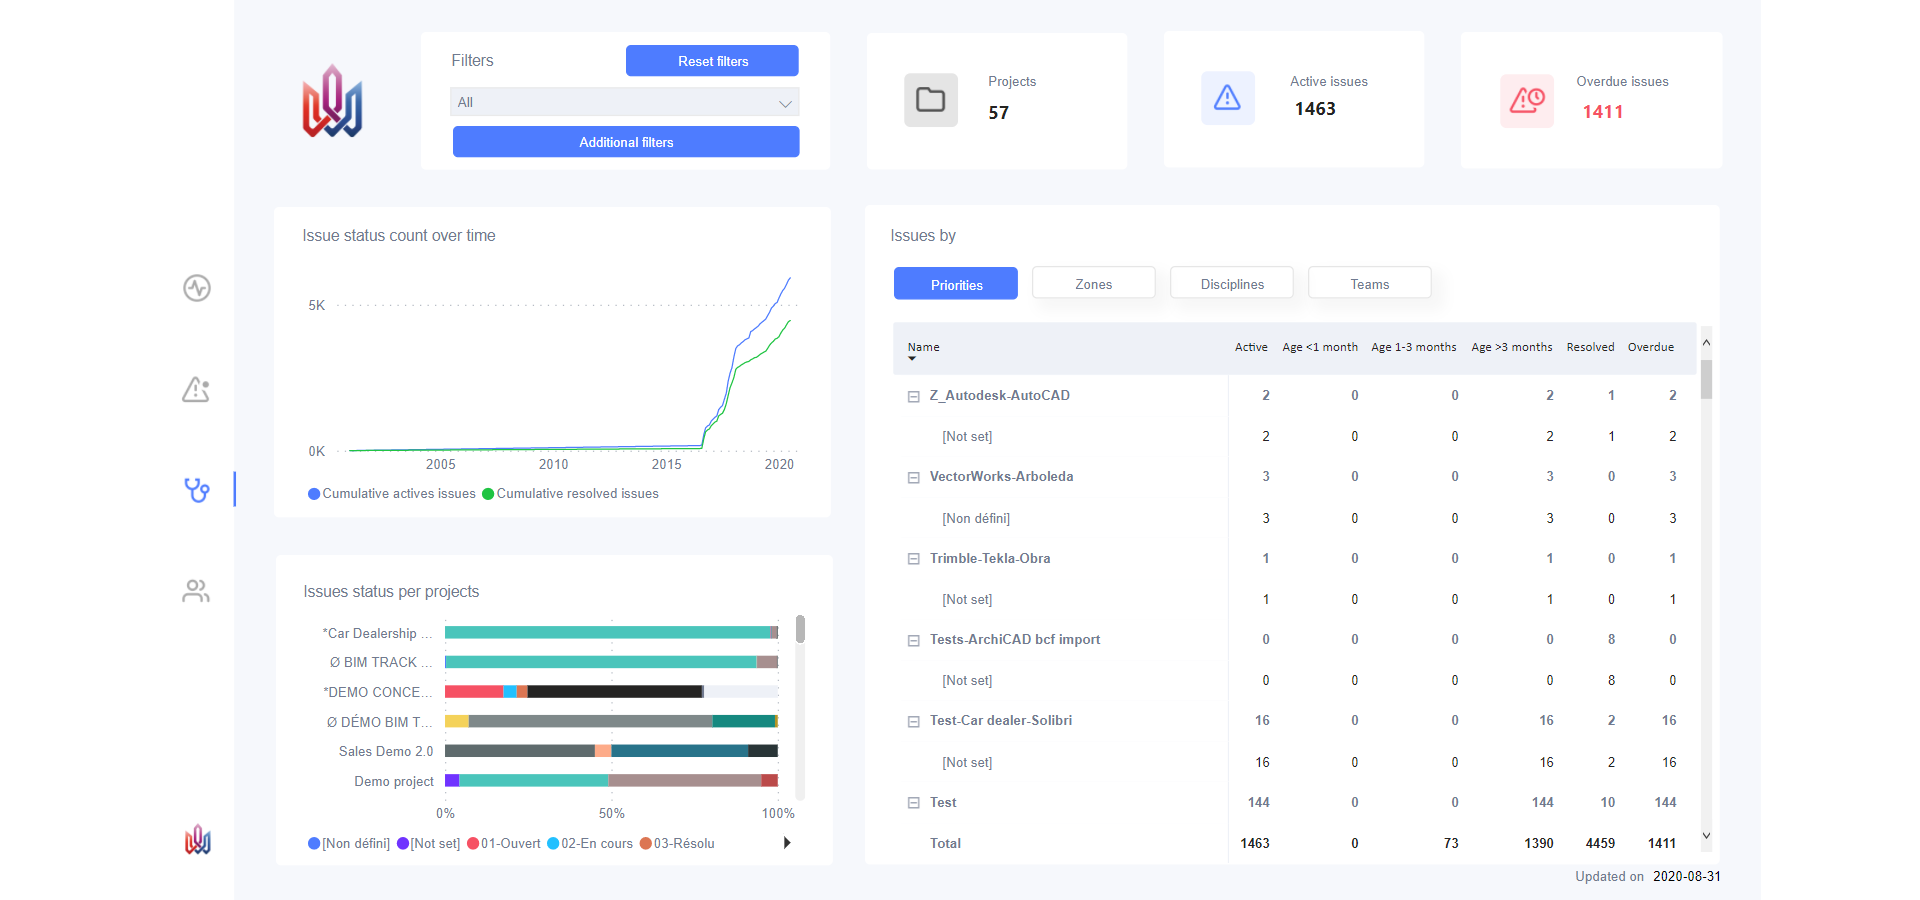
This page contains three visuals to monitor the health of your project: Issues status count over time, Issues status per projects and Issues by. The first two can be used to track and measure coordination progress. At the end of a project, the number of closed versus open issues should be very close. Using the third visual, you can filter issues by priority to see critical overdue issues, by zone to act on items close to construction phase, by discipline to help you do necessary follow-ups, and by teams to ensure they are all actively resolving their own issues and identify teams that are causing delays in coordination.
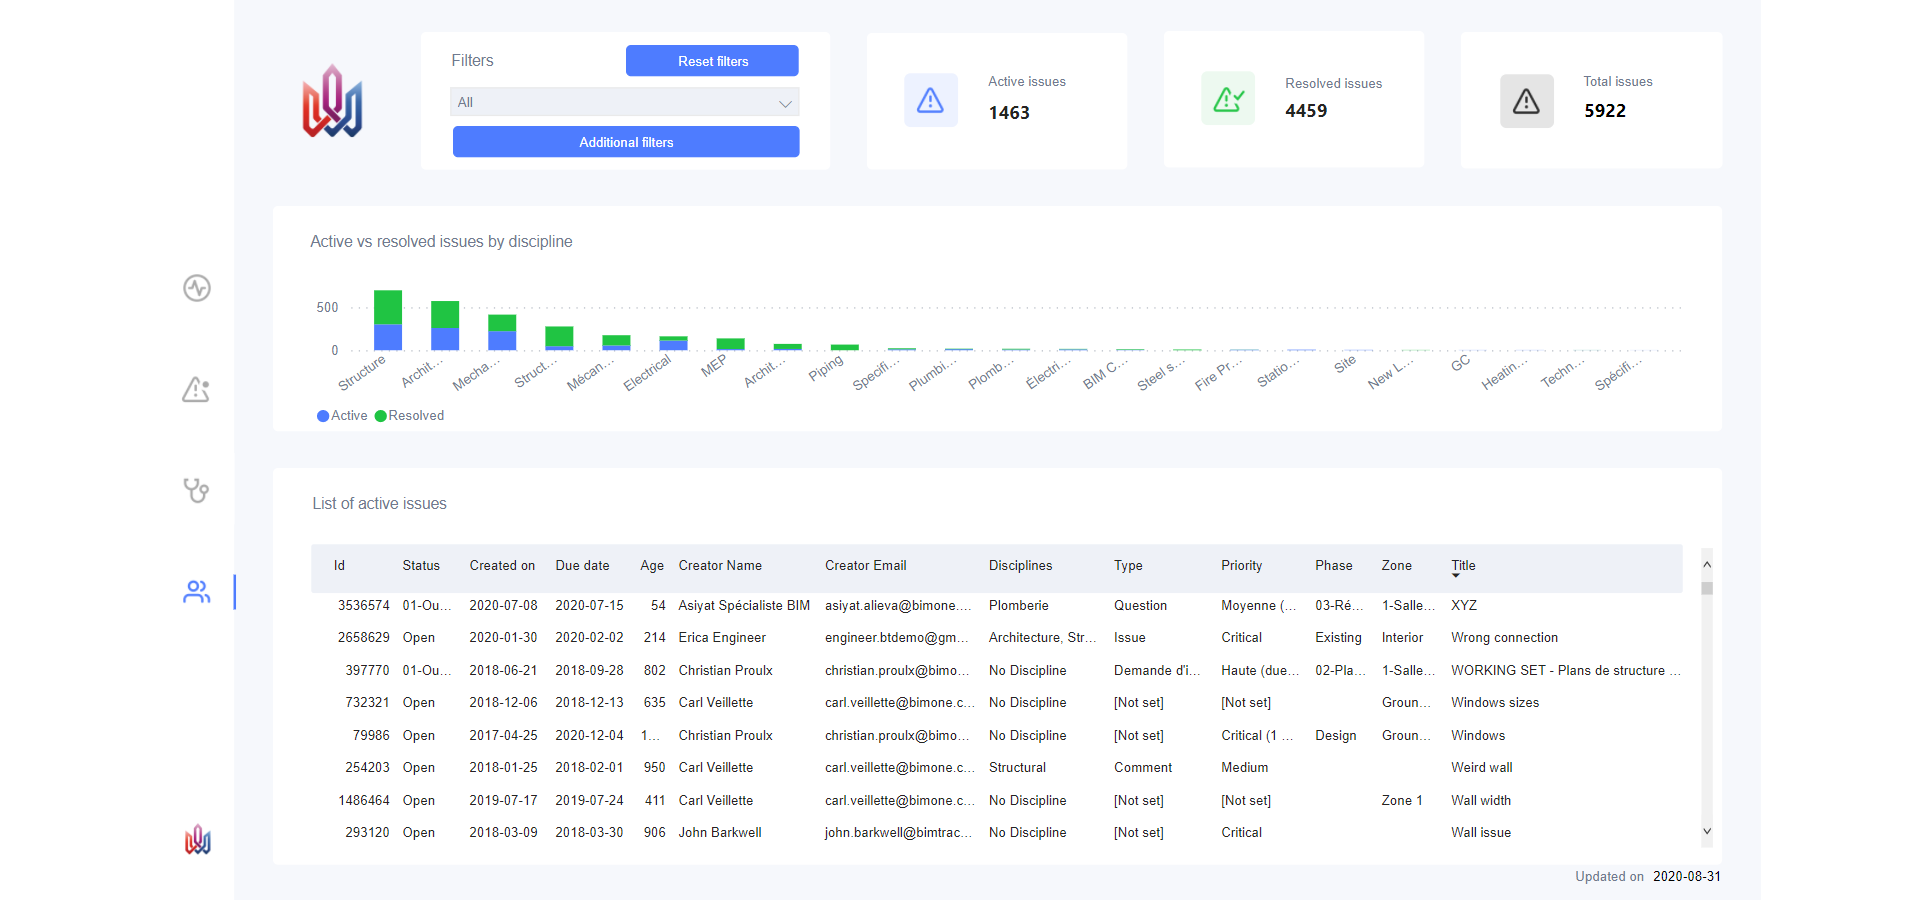
4. Issue resolution
The fourth and final page of the template is the team report. You will notice that the information provided at the top is different from the information on the other pages, so as to give everyone an overall view of the coordination. The two visuals below the header are Active vs resolved issues by discipline, i.e. the status of work by discipline, and the List of active issues. The list can be particularly useful for managers to follow up with creators of issues that have expired or have no due date, for example.